Debug everything
Debugging is the process of taking a program that has taken a path into an incorrect state, unwinding all the steps it took to get to that state and then correct the path so that the program cannot go back to that state again.
Definition of terms
State
Mode or condition of being
All programs are ultimately stateful
All bugs ultimately boil down to state mismatch
Code path
Different paths the code flows
All programs can be reduced to data flow which exists in code paths
Happy path
What the program is supposed to do
Can be many code paths
Unhappy paths (or sad paths for sad pandas)
By definition can be an infinite number of them
Defining bug
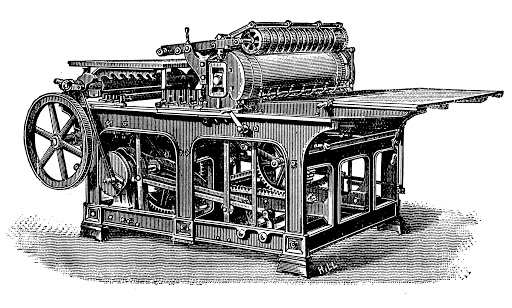
| Punch card machine | Stack of punch cards |
|---|---|
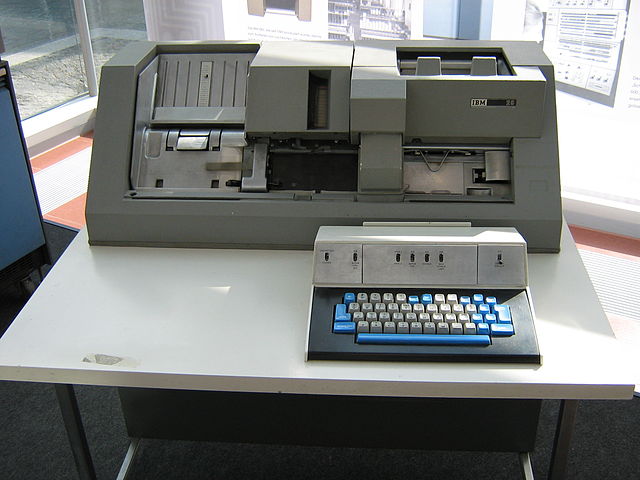 | 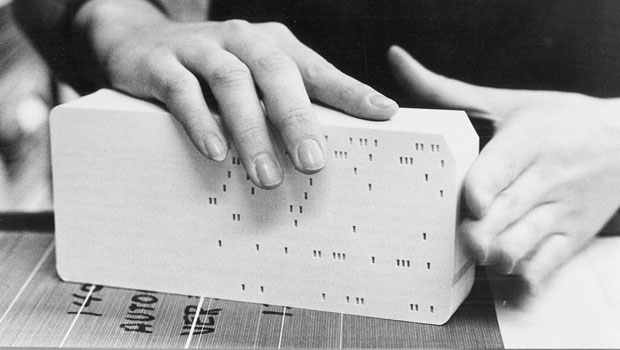 |
Bug has become an all-catch phrase for anything that can go wrong with your program. The word bug comes from a story where a literal bug got caught in the machine running through the punch cards. A 0 had all of the sudden become a 1.
In Why Programs Fail, written by Andreas Zeller, we are given a better definition.
Defect: An incorrect program code (a bug in the code)
Infection: An incorrect program state (a bug in the state)
Failure: An observable incorrect program (a bug in the behaviour)
Flaw can also be used about programs, but should be used for design flaws in the architecture, and should be taken very seriously as design flaws tend to be very expensive to fix. Flaws are however not part of debugging, but is part of a wider issue: Namely a big misconception about the real world as opposed to how the system has been built up.
Difficulties with debugging
The symptoms may not give a clear indication of the cause
Error messages that doesn’t say anything
Error messages that leads you down the wrong path
Error messages that only give you partial information
Error messages are one or more levels below the actual error
No errors
Symptoms may be difficult to reproduce
Time and space
Space problems
Different parts of the program
Client/server
Server/server
Server/database
Server/cache
Database/cache
etc
Time problems
Ordering
Chain reactions
Unclear origin (where does the error originate from)
Unclear cause (why is the error caused in the first place)
Errors may be correlated, so fixing one error can change the symptoms of another error
You have error A and B. Error A causes two errors in error B. Fixing A now changes B. The original error of B is now fixed, but a new error emerges from B that was not expected
Fixing an error may introduce new errors
You have error A. You fix error A. B and C which had fixes for the error that A produces now become faulty.
You have error A. You fix error A. D which assumed the error A was the correct value is now faulty.
Knowing the state of the program
You have the program running. What is the happy state?
Is my machine influencing the happy state?
This is the happy state on my machine. Is it the same in production?
Getting bogged down
Easy to stare yourself blind at a problem. Take a breather
Are you looking at the right piece of the code?
Noise
Some programs have a lot of noise
Can be difficult to make out what’s happening
TRAFFIC
Track the problem in a database
Reproduce the failure
Automate and simplify the test case
Find possible infection origins
Focus on the most likely origins
Isolate the infection chain
Correct the defect
Track the problem in a database
It might not be you who deal with it
You might have to deal with it over an extended period of time
Finishing the feature might be more important than getting a 100% flawless implementation. Writing down the fault will make sure it’s not lost
Other people might have to take over
Other people might have to come in and help you if it turns out the problem is bigger than you thought
The only real exception is if it’s a fault you find in the program as you yourself has introduced whilst writing. If you have to continue work on other tasks, then this immediately applies.
Reproduce the failure
To be able to reproduce the failure is important for two reasons: So that we can observe the problem and so that we can check if the problem is fixed.
Reproduce: Problem environment
We need to able to reproduce
the problem environment - the setting in which the problem occurrs.
the problem history - which steps are necessary to reproduce the problem
Good dev environment is key here. While it’s possible to do this on a production platform it’s highly discouraged for the following reasons:
Privacy: users typically don’t want other people to mess with their stuff
Ease of development: You typically lack a good dev environment in production
Cost of maintenance: It quickly becomes prohibitively expensive to take a production server/machine out of commission
Risk of experiments: Debugging typically involves running experiments, and experiments may cause damage
Things that typically can cause problems in a program, and thus are required to be known in order to reproduce the problem are:
Data: files or the database(s)
User input: Can differ in minor details, which may be relevant for a problem
Communication: Between threads, processes or machines
Time: Can influence the program execution in various ways
Random numbers: By definition make every program execution different. Does not have to be explicit. Some data structures are accessed semi-randomly for instance
Operating environments: The environment in the OS can influence the program execution
Process and thread schedules: Depends on how they are used and normally not the cause, but can influence the program execution
Abstractions: Every now and then an abstraction starts to leak in unexpected ways, and so can cause problems. Goes all the way from the physical hardware layer all the way up to whatever is underpinning your programming language of choice.
Debugging tools: Typically interfaces with the program execution, and so can both uncover problems, while also masking others at the same time
Simplifying the problem
Once we have a problem we can reproduce, we need to boil it down to its smallest possible parts. Do we need to go through all the steps in order to get there? Is it really necessary to import a 12 GB database?
The main reason the process of simplification is important is in what it removes. Every piece you can remove that is not relevant to the problem will reduce the surface area in which a problem might occur, and which you now can remove from the list of things you have to check.
For every circumstance of the problem, check whether it is relevant for the problem to occurr. If it is not, remove it from the problem report of the test case in question.
A circumstance is any aspect that may influence the problem - in short, the same circumstances one needs to reproduce the problem.
The aim of the simplification process is to produce a simple test case from a detailed problem report. Simplified test cases are easier to communicate, facilitate debugging and identify duplicate problem reports.
Find possible infection origins
In order to find possible origins we need to reason backwards from where the error occurred. Typically (always?) the failure is caused by a state mismatch. The code expects a certain value, or a range of values, and instead get something completely different. So the question we need to ask ourselves is: Where did the value come from?
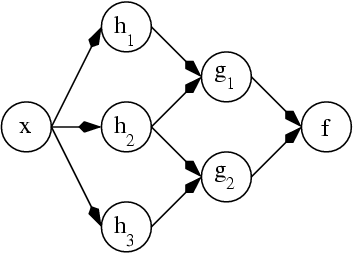
In order to effectively find possible infection origins you map depedencies in the code base. If x currently has value "asdf" but you really expected "foobar" you work yourself backwards in the code base and see at which point does the value x change within the code base. For each point you find you then start to map any variables at that point that can effect the value of x and start to map their dependencies until you have a graph of dependencies.
Once a dependancy graph is produced you can start to investigate the most likely origins of the infection.
Focus on the most likely origins
Known infections Are there any known infections from before? Have they resurfaced? Are there similar problems that could be related to this?
Causes in state, code and input Is there anything in the state, code or the input that could be the cause of the infection?
Anomalies If you run the program multiple times you will often quickly find commonalities and anomalies. Anomalies often help you locate defects and are typically good candidates for sources of infections. Ways to find anomalies include
Code coverage - code that is executed in failing runs, but not in passing runs
Call sequence - sequences of functions that occurr only in failing runs
Variable values - variables that take certain incorrect values in failing runs only
Code smells
Subjective meaning, but typically anything that goes outside of standard practice
Isolate the infection chain
Once we have a list of likely candidates we can now start to isolate the actual infection chain. What needs to be done here is to verify the cause of the failure as well as verify the infection chain. We do this by running experiments where we test whether changes in the candidate causes changes in the failure or not. While this might seem obvious, it is a step that is necessary. Programs typically have a number of anomalies in them, and while they are candidates for the failure, you do not know for sure until you have tested that it actually is so.
You might for example have a program that crashes and gives off a warning that it is missing a file just before the crash. Is the missing file a likely candidate? Yes. But it might not be the actual cause, and if it is not you now have wasted time fixing something that was not actually a problem, instead of finding the cause of the failure.
The way we run experiments is with the scientific method. We look for alternative worlds, one where the failure occurrs and one where it doesn’t. For each iteration we test a hypothesis where we have one world where we know the error occurrs, and one world where we have changed something we think might be the cause of the failure. If the error still occurrs in the world where we thought we might have located the cause, we run another iteration where we remove yet one more likely cause of the failure. Rinse and repeat until you either find the cause of the failure (the failure no longer occurs, or another known failure occurs) or you have run out of likely causes, in which case you have to back a step and find another hypothesis.
Correct the defect
You have isolated the infection chain and validated the defect. Now what?
Validate again
Think before you code
Apply fix
Does the failure no longer occurr? It’s fixed! Yes?
Look out for the following
Did the fix introduce new problems?
Was the same mistake made elsewhere?
Sometimes it is easy to find the defect, but difficult to fix. It may be that you are unable to change the code because it is from a 3rd party, it might that the risk is too high for a fix, or it might be a design flaw that requires a major redesign of the system. Spam filters for example is a workaround for the email system where anyone can spoof anyone. The proper fix would be to rewrite the email system, but it has been deemed too risky and costly to do so.
Toolbox
Assortment of techniques and tools to use in debugging.

Error messages
Any exception thrown in a program will have an error message. A lot of the time just reading the error message will give you the problem.
Stack traces
All programming languages have a stack. Each level in the stack will have a local scope with its current state. A new function/method call within the code will create a new level in the stack, with a new local state, where the code is executed. IIn most programming langauges this information is given back when an exception is thrown by the language. Reading the stack trace allows you to trace how the program came to the current invalid state in the current space and time of the program. It will also give you the file, line number and the error message of what caused the (immediate) error.
Read the source Luke
Should maybe be obvious, but this includes not just your own code, but also that of others; including libraries, frameworks and systems.

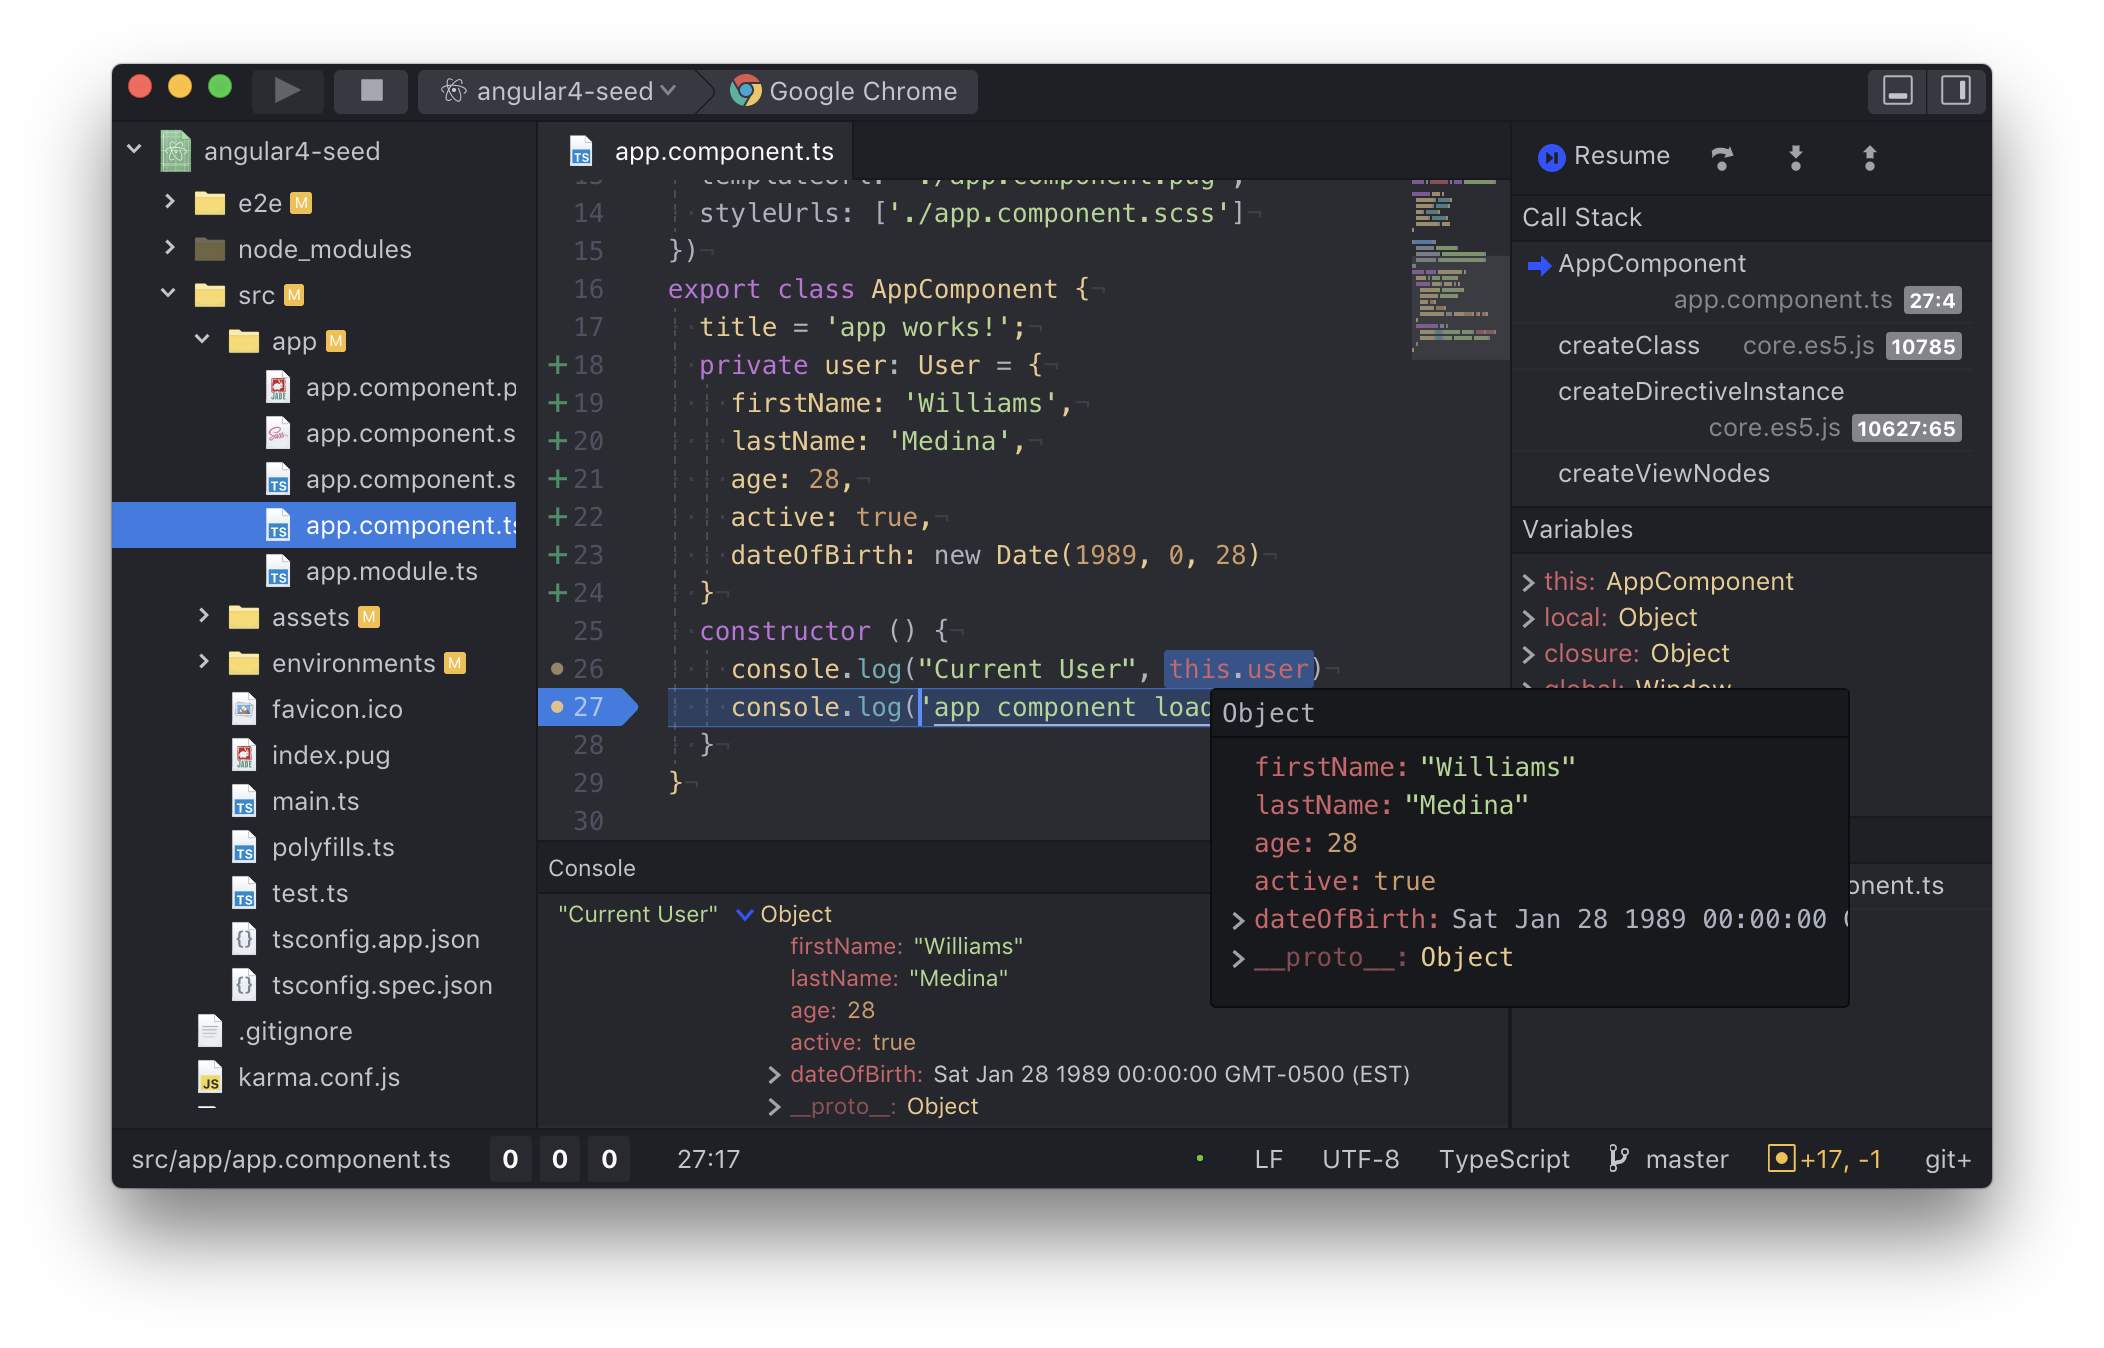
Debugger
A debugger allows you to run a program and at will stop it at a breakpoint. Once the program has been stopped at the breakpoint you can inspect the current state and perform a number of operations. Notice that it is only one thread that has been stopped. Any other threads in your program are still running.
Step
Step over
Step in
Step out
Continue
Stop
Drilling
In addition the more advanced debuggers will allow you to go up in the call stack and inspect the state there as it was before you arrived at the current state.
Asserts
Asserts can be used in what is called defensive programming, but also in the phase where you try to isolate infection chains. You test that the data has a certain shape at the beginning of a function/method before proceeding with calculations on the data. Takes the form of a boolean assertion (has to return true) along with data that is thrown if the assertion return false. The data typically is a string, depending on the language the assertion also allows you to send along other data that could be important. A well designed assertion will give enough data to be useful at the error message level.

Dependancy mapping
Build a graph of state dependancies from the code base where each variable you think might be a candidate for an infection is mapped out in terms of what it effects, and what the variable itself effects.
Googling an error message (or looking at SO) and/or stack trace can often get you to the answer of what potential causes are. For common errors occurring in popular languages/frameworks/libraries this can significantly reduce the time to find a solution. There is a danger here however, and that is that it might have taken the original author significant time to come to the conclusion that he/she did, and you have skipped that entire process. Sometimes there is a significant surface area that this error can occurr in, and by copy and pasting a solution you have not really understood the problem itself and as a result most likely just made the problem worse.

Print is a very simple and easy measurement you can put in for some quick and dirty checks on how your code performs. While debuggers gives you a lot of power to slow things down, sometimes timing issues prevent you from using debuggers and there prints can be a saving grace.
Logging
There are several libraries for almost any programming language that supports logging. Logging is a standardnized way of logging information to a sentralized repository of logs. The log repository can be a server, files, database, etc. The easiest to implement is a standard log file where all information sent to the logger is gathered. Logging can have several levels of logging (DEBUG, TRACE, INFO, WARNING, ERROR, CRITICAL, ALL) that allows you turn on and off the verbosity of logs. Logging typically involves a bit of work in the beginning, but pays dividends ever after. Logging is also one of the techniques that can be used in production to gather important data from a running application.

Narrowing/flag planting
Narrowing or flag planting is a technique where you use print/log statements to see how far your code executes before it crashes. The printing can also contain useful information of the current state between each executed statement. This can sometimes be considered a poor man’s debugger, but depending on the program it can be a very powerful technique. It typically shines when you start to have multiple threads involved that interacts tightly with each other. In situations like that a debugger typically struggles as it can only halt a single thread at a time.

Divide and conquer
For situations where you don’t really know where a bug might appear and the stack trace doesn’t really give much useful information you can use divide and conquer. Take a point in the program and diverge the path in that point. If the program no longer crashes the bug exists in the other half. Find a new point, rinse and repeat until you have honed in on the area where the bug occurs. Start applying other techniques at this point.

Tracing bullets
When firing in the dark there is no way to see how close you are to the target, and so every fifth to tenth bullet is a tracing bullet, which lights up the path it travels so that you can see where you are aiming. Tracing bullets in software follows the same idea, where hard to track down bugs are given a unique id which acts as a tracing bullet for data that travels through your system. At each point you can see how the data has changed over time. Used in combination with logging it can be used in production systems to trace how data travels through complex systems.

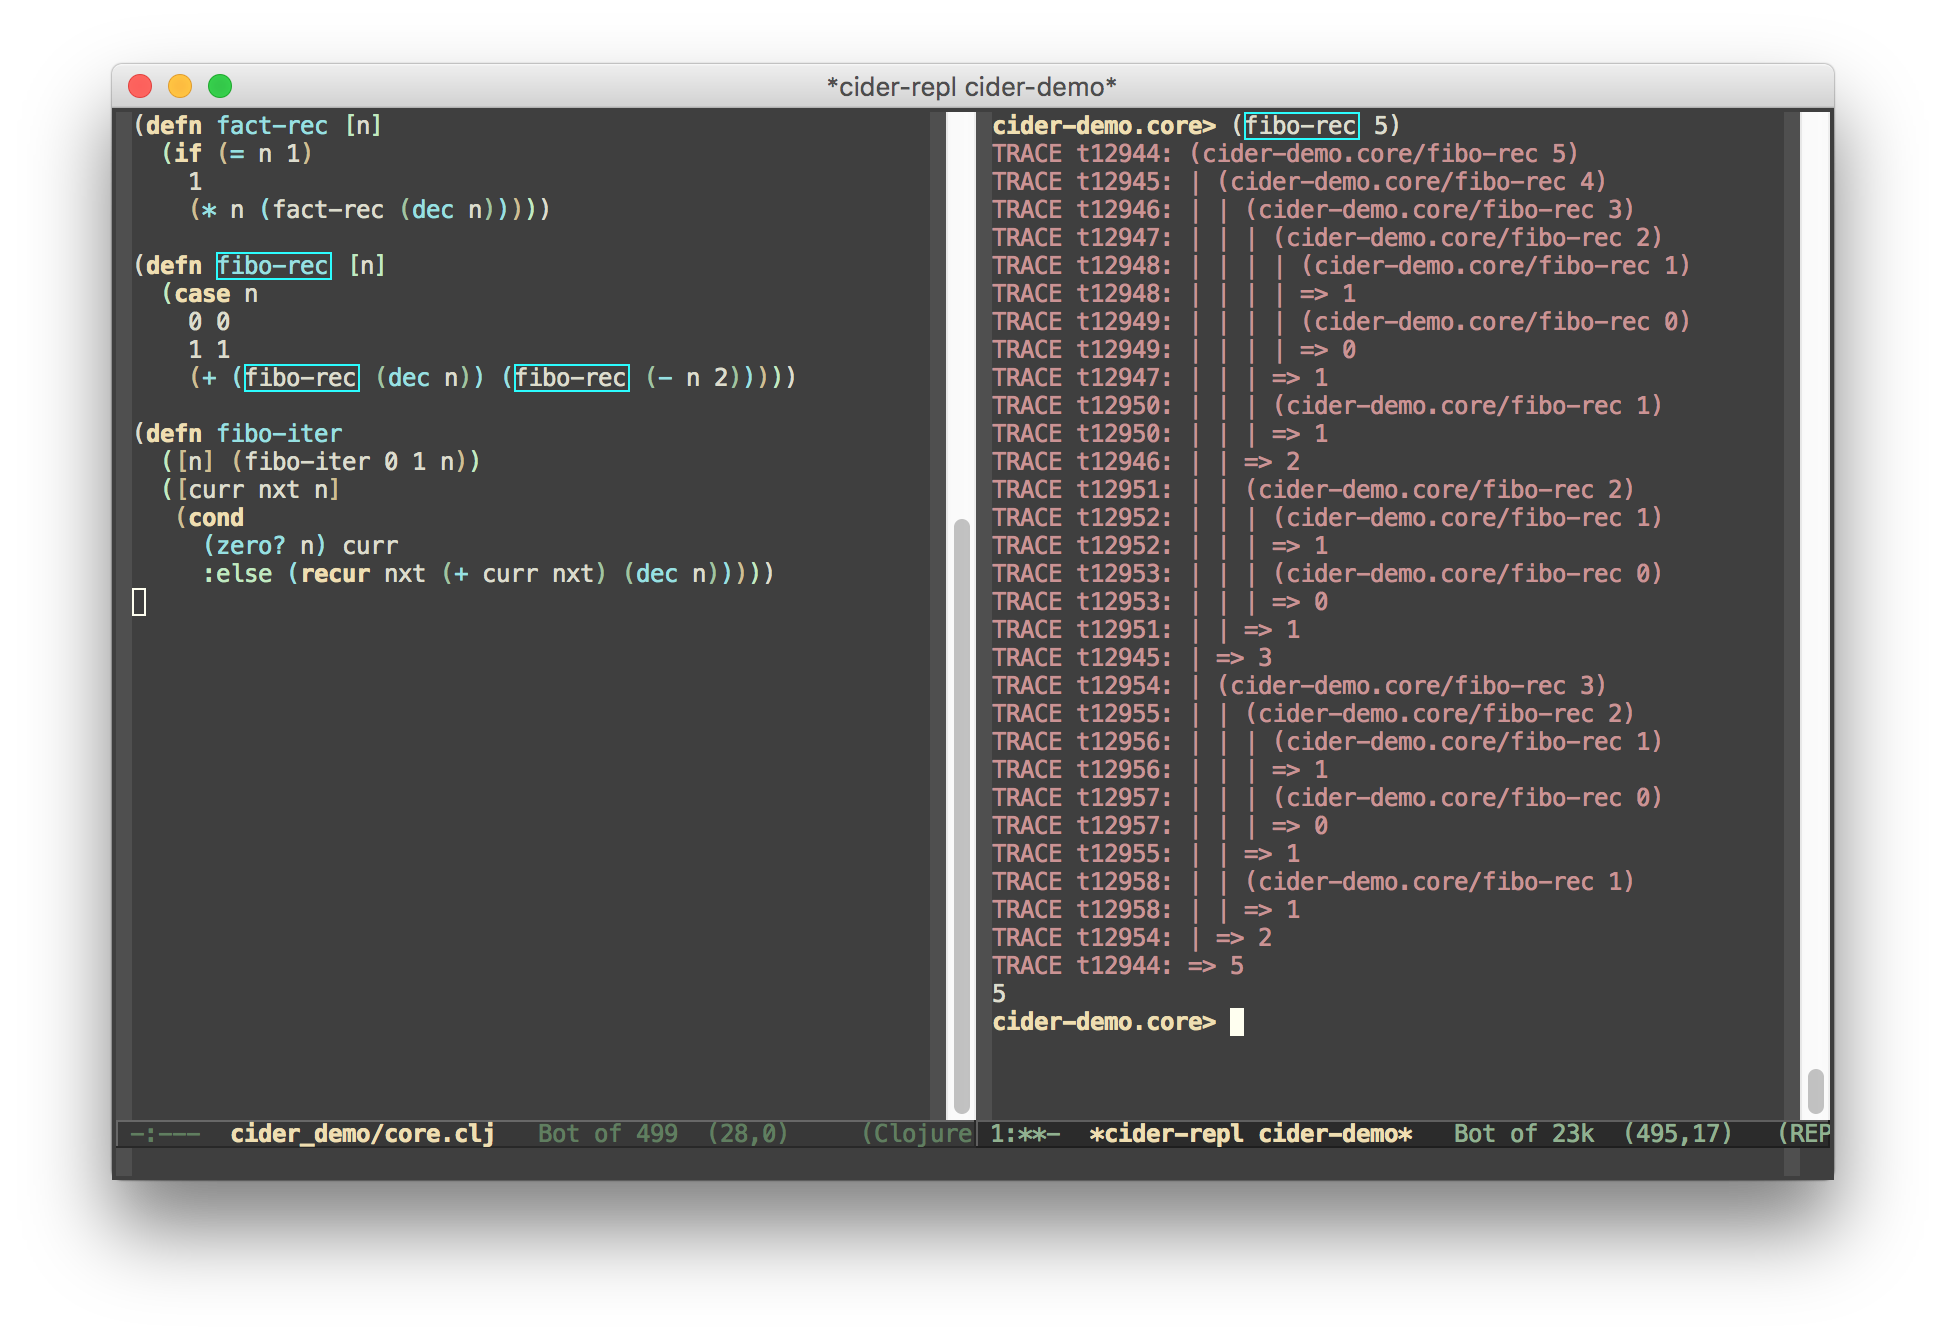
Tracing
For advanced usage you can use tracing tools (language specific) to track how a variable changes over time. This can be a very spammy tool, so use with caution.
git history
Git has a lot of history and lots of tools for digging through the history of the project. Seeing the changes to a function/method over time can give ideas of possible errors as well as give an idea of how it’s developed and so put things into its proper context.

Ask a friend
When asking a friend you’re forced to unpack the problem so that he/she can understand the problem. This in itself can help you come across a solution. The questions asked by your friend as you explain also tend to help you find new angles on the problem.

Talk to a rubber duck
Old story of a programmer who used to have a rubber duck at his desk. Whenever he ran into a problem he would sit down and explain the problem to the duck. If you lack any handy friend nearby, this is a good substitute.

Drivers
Small piece of code that runs the problem code in a managed way.
Stubs/Mocks
Working with something that takes a lot of time to interact with, or is difficult to interact with, but you are sure is not the cause? Write a stub/mock that mimics the behaviour and have it replace that part in your code to increase the feedback loop.
Examples can include payment gateways, emails, anything I/O driven.

The dark arts
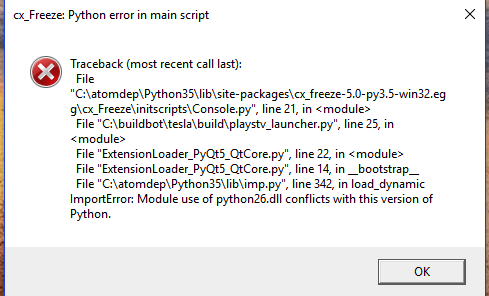
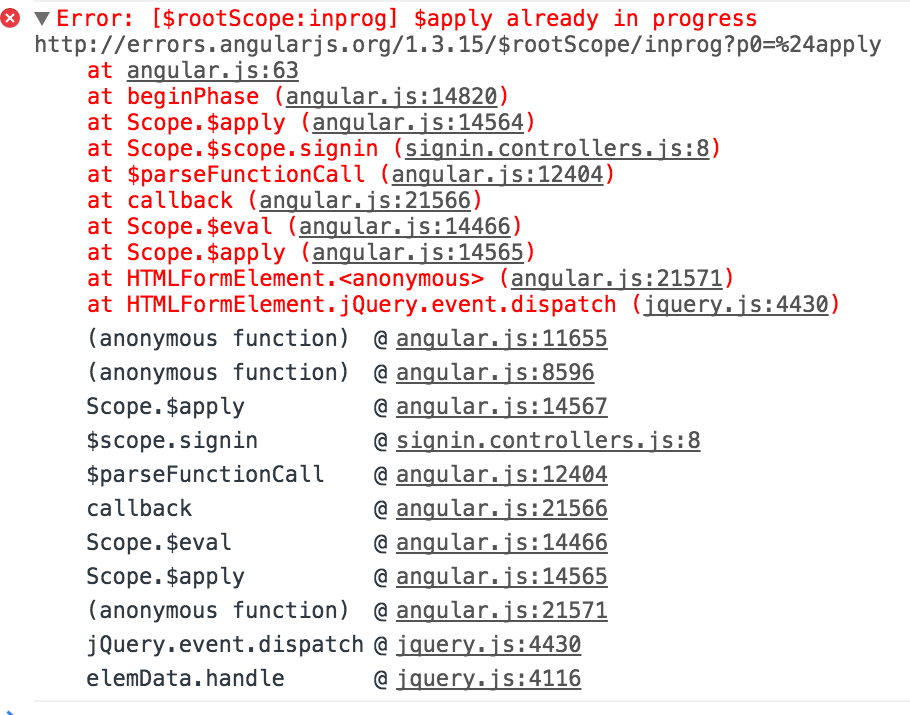
 |  |
 |  |
There’s a bunch of stuff you can do here that you really shouldn’t, but sometimes it’s what’s left. If possible, avoid using injections and directly editing library source code.
Final thought
Have a tight feedback loop. The longer you have to wait to see the result of your experimentation, the longer it will take to fix the problem.
